··· connecting the dots ···
Home
About
Categories
All
(9)
clojure
(1)
crypto
(1)
emacs
(3)
lisp
(3)
math
(1)
ml
(1)
mysql
(1)
python
(3)
r
(1)
shiny
(1)
spark
(1)
stat
(1)
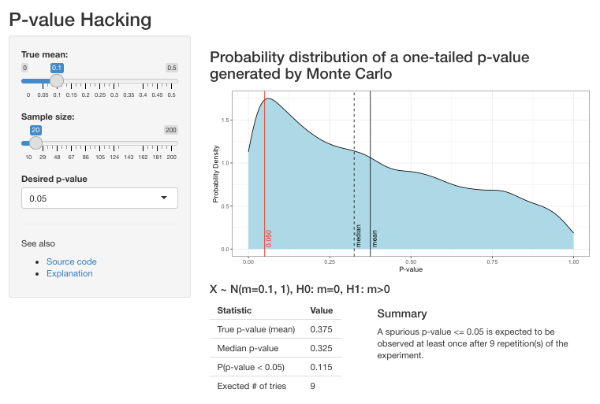
P-Value Hacking Demo App
stat
r
shiny
An interactive demo app illustrating the NNT’s paper on P-value hacking.
Aug 17, 2022
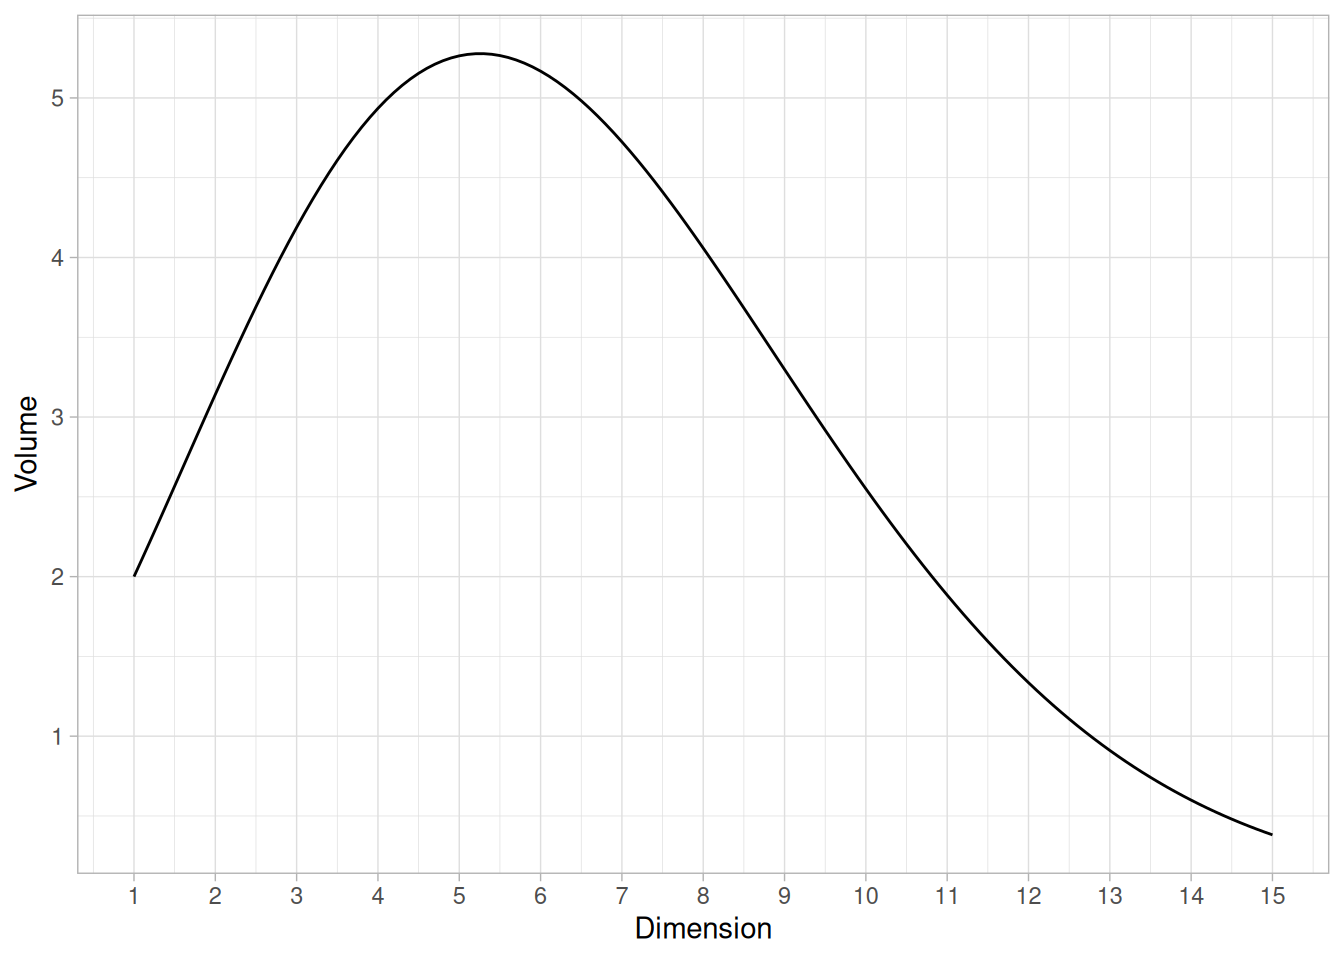
On Volumes of N-Dimensional Spheres
math
Volumes of N-dimensional spheres is a well-studied subject, yet there is still some confusion about their meaning.
Feb 12, 2022
Machine Learning with Clojure and Spark using Flambo
clojure
spark
ml
A tutorial on training a Logistic Regression classifier on Spark using Clojure.
Apr 20, 2015
MySQL Connector: Inherited Transactions
mysql
python
The MySQL Connector (Python Driver) seems to be leaking file descriptors during forks.
Jun 27, 2013
Multimethods in Python
python
Clojure-styled multimethods can be easily added to Python using the Multiple Dispatch technique.
Jun 6, 2013
A Simple Callback Chain Macro for Elisp
lisp
emacs
A macro for Emacs Lisp to replace deeply nested callback chains with nice callback pipelines.
Jun 6, 2012
The Thread Operator in Elisp
lisp
emacs
Anaphoric thread macro similar to the Clojure’s ‘->’ for Emacs Lisp.
May 9, 2012
Pure Python Paillier Homomorphic Cryptosystem
python
crypto
A Paillier homomorphic cryptosystem implemented in pure Python.
Jun 28, 2011
Tail Recursion Without TCO
lisp
emacs
It is well known that Emacs Lisp, like many other Lisp dialects, has no Tail Call Optimization (TCO). Nevertheless, it’s possible to add proper recursion to Emacs Lisp with the help of a few macros.
Aug 20, 2010
No matching items
© Copyright 2012-2025
Mike Ivanov